Tendy Mart sales Analysis
Project Date : Dec 2024
Problem Statement:
Trendy Mart, a mid-sized retail company, was experiencing stagnation in revenue growth and lacked visibility into their customer behavior, regional performance, and product profitability. Despite having access to transactional data, they were unable to draw actionable insights to guide business strategy, improve customer retention, optimize product offerings, or tailor regional marketing.
Solution:
Built a dynamic and interactive Power BI dashboard that helps Trendy Mart's stakeholders understand:
-
Overall sales and profit trends
-
Seasonal sales patterns
-
Regional performance analysis
-
High-value and low-engagement customers
-
Product categories and sub-categories driving sales
-
Managerial performance and state-wise contributions
download the pbix file of this report ( https://drive.google.com/file/d/1-njFvnJGenTD3gnp8j7rmqFY0Fh6HAjG/view?usp=sharing )
Lets Dive deep into Each and Every insight.

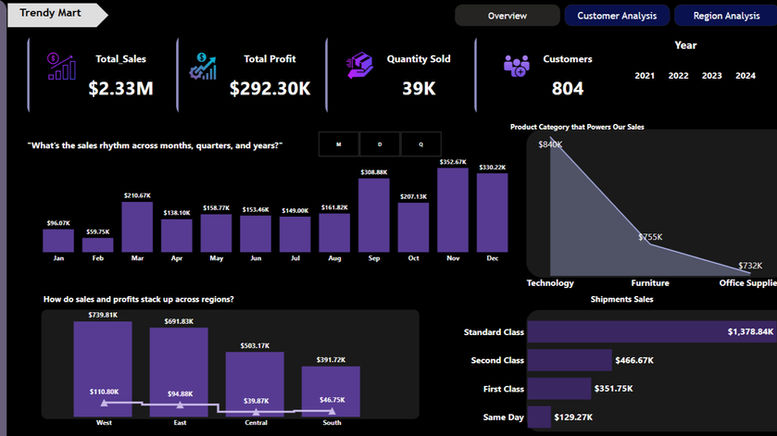
Key Metrics Overview: Trendy Mart generated $2.33M in sales and $292.3K in total profit by serving over 800 customers and selling 39K+ items.he strongest quarter, making it a key focus period for future strategy.

The monthly breakdown reveals:
-
A slow start in January ($96.07K), followed by a steady growth through Q2 and Q3.
-
A major sales spike in September ($308.8K) and December ($390.22K), likely driven by festive demand or targeted campaigns.
-
The Q4 period (Oct–Dec) appears to be the strongest sales quarter, suggesting seasonality effects that should be leveraged in future campaigns.


The West region leads with $739.81K in sales and $110.80K in profit, making it the most profitable market.
The East region follows in sales ($691.83K) but shows slightly lower profits ($94.88K).
The South region has the lowest performance in both sales ($391.72K) and profit ($46.75K), suggesting room for improvement or strategic reevaluation in that region.
Technology is the powerhouse, generating a massive $840K in sales, far ahead of Furniture ($755K) and Office Supplies ($732K).
This clearly shows that tech-related products are the primary revenue drivers, and focusing marketing efforts on this category could maximize returns.

The majority of sales are delivered via Standard Class, totaling $1.37M, indicating it's the most preferred and scalable shipping method.
While First Class and Second Class have moderate sales ($351.75K and $466.67K respectively), Same Day delivery lags behind at $129.27K, which may be due to higher costs or limited availability.
Investing in Standard Class logistics seems to be the most cost-effective and profitable route.

Products like Easy-staple paper (46 repeat purchases) and Staple envelopes (43 purchases) lead the list of repeat buys, indicating strong customer loyalty for everyday office supplies.
Most frequently reordered products are low-cost, high-utility items, signaling consistent demand from returning customers.
These insights can guide bulk purchase deals, subscription offers, or bundling strategies to increase repeat sales.
These are the customers who doesn't bought from Trendy Mart more than once.
suggested a discount for these customers for repurchase.


Top and Bottom customers breakdown.
Sean Miller tops the customer list with $25,043.05 in sales, followed by Tamara Chand and Raymond Buch, making them high-value individuals worth retaining through loyalty programs or targeted offers.
The bottom list shows customers who purchased only once, such as Ricardo Emerson and Jocasta Rupert, offering potential for win-back campaigns or feedback-driven re-engagement strategies.
Sales are spread across various sub-categories, with Chairs, Phones, and Storage items performing best.
Technology sub-categories like Phones and Accessories consistently show high peaks indicating strong customer demand.
This suggests a focus on tech and ergonomic office products could increase overall revenue.
States like California, New York, and Texas appear to have deeper shades on the map—indicating higher sales density.
This highlights urban and coastal states as top markets and provides guidance for regional ad spend and resource allocation.

Sadie Parvinhove leads with $739.81K in total sales, followed closely by Chuck Magee ($691.83K).
Fred Suzuki shows the lowest performance ($391.72K), which may require closer monitoring, coaching, or regional adjustments to improve output.
-
The West region consistently outperforms the others, especially in Q4.
-
November and December show sales peaks across all regions, validating a strong year-end trend.
-
The South region lags in monthly performance, signaling potential for improved targeting or product optimization.


