Consumer Goods Analysis
Project Date : Mar 2023
Domain: Consumer Goods | Function: Executive Management
Atliq Hardwares (imaginary company) is one of the leading computer hardware producers in India and well expanded in other countries too.
However, the management noticed that they do not get enough insights to make quick and smart data-informed decisions.
Tools Used :

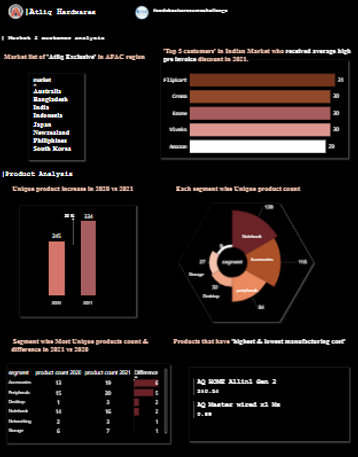
Query : Provide the list of markets in which customer "Atliq Exclusive" operates its business in the APAC region.
solution : Atliq Exclusive operates in multiple markets in the APAC region, including Australia, India, Bangladesh, Indonesia, Japan, New Zealand, Philippines, and South Korea.
Understanding the markets where a business operates can provide insights into its regional strategy, target customer segments, and potential growth opportunities.
Solution:
The Report will help the management to get enough insights to make quick and smart data-informed decisions.
Navigate to the Interactive dashboard LINK( https://www.novypro.com/project/consumer-goods-domain-insights )
Lets Dive deep into Each and Every insight.
Query : What was the percentage increase in unique products for a specific entity between 2020 and 2021?
solution : 245 unique products in 2020, which increased to 334 unique products in 2021.
This represents an impressive 36% increase in unique products. Such a substantial increase in unique products indicates a commitment to diversifying and expanding the entity's product offerings.
It also reflects a desire to stay competitive in the market by attracting new customers with a broader range of products.


Query : Provide a report with all the unique product counts for each segment and sort them in descending order of product counts.?
solution : After analyzing the available data, it was found that the notebook segment had the highest unique product count, with 129 unique products. Accessories and peripherals followed closely, with 116 and 84 unique products, respectively. The desktop segment had 32 unique products, while the storage and networks segments had 27 and 9 unique products, respectively.
Sorting the segments in descending order by their unique product counts, we get the following sequence: notebook, accessories, peripherals, desktop, storage, and networks. This data provides valuable insights into the different segments' relative importance in terms of product offerings and can help businesses allocate resources more effectively to each segment.
Query : Follow-up: Which segment had the most increase in unique products in 2021 vs 2020?
solution : In analyzing the unique product counts across different segments in 2020 and 2021, it was observed that the Accessories segment had the most significant increase in unique products with a count of 13 in 2020 and 19 in 2021, representing a difference of 6. Following this was the Peripherals segment, which had a count of 15 in 2020 and 20 in 2021, indicating a difference of 5.
On the other hand, the Desktop and Notebook segments had an increase in unique products by 2 and 2, respectively, while the Networking and Storage segments had an increase in unique products by 1 each.
Overall, the Accessories and Peripherals segments had the most substantial increase in product counts, indicating potential growth and demand in these areas. The increase in product counts in the Desktop and Notebook segments may suggest a growing demand for these types of devices. The increase in the Networking and Storage segments may also suggest potential growth in these areas, albeit at a slower rate.

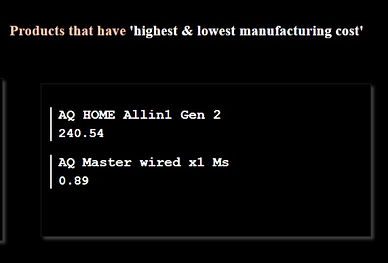
Query : Get the products that have the highest and lowest manufacturing costs?
solution : The manufacturing costs of the products in the inventory, it was observed that AQ Home Allin1 gen 2 had the highest manufacturing cost of 240.54 dollars. In contrast, AQ Master wired x1 Ms had the lowest manufacturing cost of 0.89 dollars.
AQ Home Allin1 gen 2, with its high manufacturing cost, may indicate that it is a premium product with advanced features or uses high-quality components. On the other hand, AQ Master wired x1 Ms, with its low manufacturing cost, may suggest that it is a budget-friendly product with minimal features or uses lower-quality components.
Query : Generate a report which contains the top 5 customers who received an average high pre_invoice_discount_pct for the fiscal year 2021 and in the Indian market.?
solution : The top 5 customers in the Indian market who received the highest average pre-invoice discount percentage during the fiscal year 2021 are Flipkart at 31%, Croma at 30%, Ezone at 30%, Viveks at 30%, and Amazon at 29%.
This insight provides valuable information to businesses operating in the Indian market, specifically those who offer pre-invoice discounts to their customers. By analyzing the data and identifying the top 5 customers who received the highest average discounts, companies can gain insights into the preferences and behaviors of their customers, and adjust their strategies accordingly to better compete in the market.


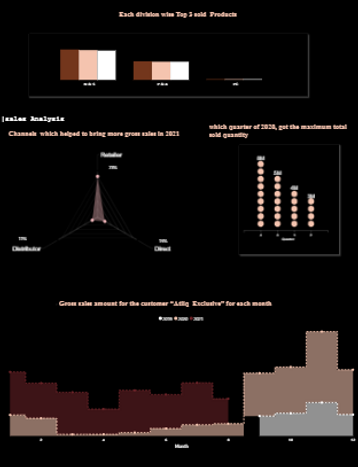
Query : Get the complete report of the Gross sales amount for the customer “Atliq Exclusive” for each month. This analysis helps to get an idea of low and high-performing months and take strategic decisions.?
solution : From the chart November month of 2020 has highest performing month, march, april are the lowest performing month.
Note: To see total gross amount of each and every month, click on the interactive dashboard link given above.
Query : . In which quarter of 2020, got the maximum total sold quantity?
solution : During the year 2020, the maximum total sold quantity was achieved in Quarter 4, with a sales volume of 8 million. This was followed by Quarter 3, which saw 5 million units sold, and Quarter 1 and Quarter 2, which recorded 4 million and 3 million units sold, respectively.
This information can help businesses plan their inventory and production schedules, to ensure they have adequate stock levels to meet customer demand during peak periods.


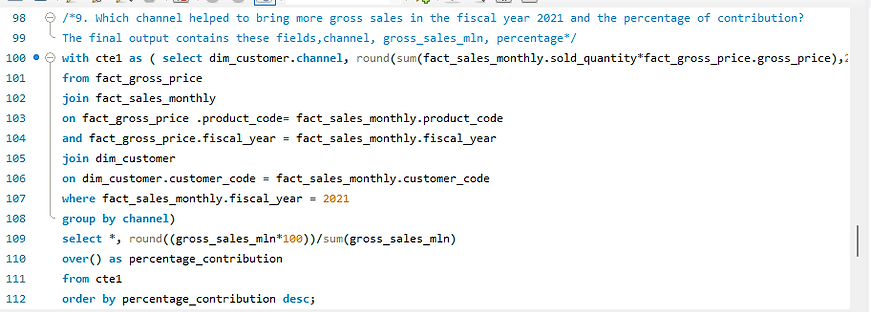
Query : Which channel helped to bring more gross sales in the fiscal year 2021 and the percentage of contribution?
solution : In the fiscal year 2021, the channel that contributed the most to gross sales was the retailer channel, accounting for 73% of total sales. the direct channel contributed 15%.,while the distributor channel contributed 11% of sales.
as it highlights the importance of having a strong retail strategy to drive sales. Companies can use this information to evaluate their sales channels and assess the effectiveness of their distribution strategy. By focusing on their retail channel, businesses can work to strengthen their relationships with retailers, optimize their product offerings, and improve their marketing efforts to increase sales. Additionally, companies may also consider investing in their direct sales channels to diversify their revenue streams and reduce their dependence on third-party retailers.
Query : Get the Top 3 products in each division that have a high total sold quantity in the fiscal year 2021?
solution : In the fiscal year 2021, the channel that contributed the most to gross sales was the retailer channel, accounting for 73% of total sales. the direct channel contributed 15%.,while the distributor channel contributed 11% of sales.
as it highlights the importance of having a strong retail strategy to drive sales. Companies can use this information to evaluate their sales channels and assess the effectiveness of their distribution strategy. By focusing on their retail channel, businesses can work to strengthen their relationships with retailers, optimize their product offerings, and improve their marketing efforts to increase sales. Additionally, companies may also consider investing in their direct sales channels to diversify their revenue streams and reduce their dependence on third-party retailers.

SQL Queries
Answered these Query Request in MYSQL using SQL.
1: Provide the list of markets in which customer "Atliq Exclusive" operates its business in the APAC region?
OUTPUT


2: What was the percentage increase in unique products for a specific entity between 2020 and 2021?

OUTPUT

3: Provide a report with all the unique product counts for each segment and sort them in descending order of product counts.?

OUTPUT

4: Follow-up: Which segment had the most increase in unique products in 2021 vs 2020?
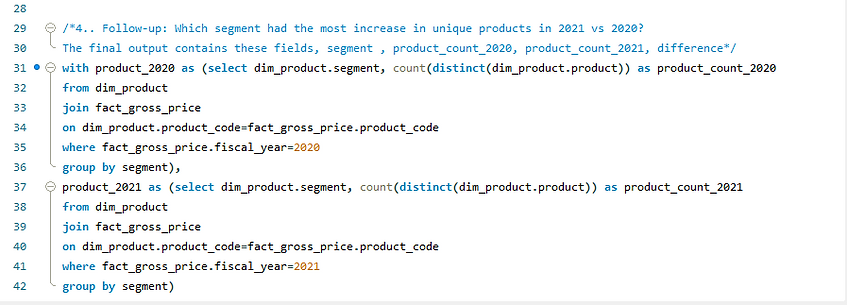
OUTPUT

5: Get the products that have the highest and lowest manufacturing costs?

OUTPUT

6: Generate a report which contains the top 5 customers who received an average high pre_invoice_discount_pct for the fiscal year 2021 and in the Indian market.?

OUTPUT

7: Get the complete report of the Gross sales amount for the customer “Atliq Exclusive” for each month. This analysis helps to get an idea of low and high-performing months and take strategic decisions.?

OUTPUT

8: In which quarter of 2020, got the maximum total sold quantity?

OUTPUT

9: Which channel helped to bring more gross sales in the fiscal year 2021 and the percentage of contribution?
OUTPUT

10: Get the Top 3 products in each division that have a high total sold quantity in the fiscal year 2021?

OUTPUT
