Project Date : Aug 2022
Market Sales Analysis
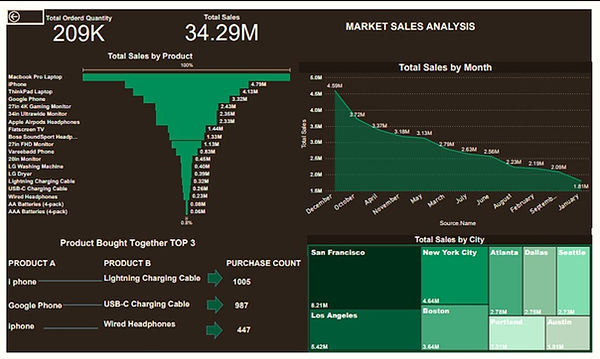
This interactive dashboard dives into 209K orders and $34M in total sales to spotlight the top-performing products, peak sales months, and best-selling cities like San Francisco and New York.
It also uncovers frequently bought-together items, helping businesses optimize product placement and bundling strategies.
Built using Tableau and Python, this project offers a clear view into customer behavior and regional sales trends—empowering smarter inventory and marketing decisions.
Tools Used :
The Report will help to identify the top-performing products by segment and their profitability, as well as to understand the buying behavior of customers and the factors that drive sales in each city. The insights gained from this analysis will help in developing effective marketing and sales strategies to improve overall sales performance
full dashboard LINK( https://github.com/ilaki-prog/sales-analysis-powerbi-dashboard)
Lets Dive deep into Each and Every insight.

The market sales analysis reveals a total order quantity of 209k, which resulted in total sales of 34.29 million.
This information indicates that there is a high demand for the products being sold in this market, as evidenced by the large number of orders.
Additionally, the total sales figure suggests that the products being sold are relatively high-priced, as the total revenue generated is significant.
Further analysis of the sales data could reveal which specific products are driving the majority of the revenue, and whether there are any patterns in customer buying behavior that could be leveraged to further increase sales.

The market analysis reveals that the MacBook Pro laptop is the highest selling product with 8 million units sold, followed by the iPhone with 4.7 million units sold. The ThinkPad laptop and Google phone follow with 4.13 million and 3.3 million units sold, respectively. In addition, the 27-inch 4K gaming monitor and the 34-inch ultrawide monitor have sold 2.43 million and 2.35 million units, respectively, while Apple AirPods headphones have sold 2.33 million units. Finally, flat-screen TVs have sold 1.44 million units, with other products following.
This information indicates that there is strong demand for technology-related products, particularly those from Apple and those that are gaming-related, such as the 4K gaming monitor. The popularity of the ThinkPad and Google phone suggests that there is still significant demand for non-Apple products in the technology market.
Moreover, the sales figures for the Apple AirPods and flat-screen TVs highlight the importance of audio and visual entertainment in the consumer market. The popularity of the 34-inch ultrawide monitor suggests that customers are interested in larger and more immersive viewing experiences.

The market analysis reveals that San Francisco has the highest total sales at 8.21 million, followed by Los Angeles with 5.42 million and New York City with 4.64 million. Boston and Atlanta follow with 3.64 million and 2.78 million in sales, respectively. The sales figures for Dallas, Seattle, and Portland are relatively close, with sales of 2.75 million, 2.73 million, and 2.31 million, respectively. Finally, Austin has the lowest total sales at 1.81 million.
This information highlights the importance of location in driving sales, as San Francisco and Los Angeles have significantly higher total sales than other cities. The high sales figures for these cities may be due to their larger populations and higher levels of consumer spending.
Moreover, the relatively close sales figures for Dallas, Seattle, and Portland suggest that these cities have similar consumer preferences and spending patterns. Further analysis of the sales data could reveal insights into the specific factors driving sales in each city, such as demographics, local economies, and cultural preferences.
Understanding the factors driving sales in each city could help companies tailor their product offerings and marketing efforts to better meet the needs and preferences of customers in different regions, potentially leading to increased sales and revenue.

Moreover, the relatively close sales figures for March, July, and June suggest that there may not be significant seasonal differences in consumer spending during these months. Further analysis of the sales data could reveal insights into the specific factors driving sales in each month, such as promotional campaigns and product launches.
Understanding the seasonal and monthly trends in consumer spending could help companies plan their product offerings and marketing strategies accordingly to maximize sales and revenue.
The market analysis shows that December has the highest total sales at 4.59 million, followed by October with 3.72 million and April with 3.37 million. November and May follow with 3.15 million and 3.13 million in sales, respectively. The sales figures for March, July, and June are relatively close, with sales of 2.79 million, 2.63 million, and 2.56 million, respectively. Finally, August, February, and September have lower sales figures, with sales of 2.23 million, 2.19 million, and 2.09 million, respectively, and January has the lowest sales at 1.81 million.
This information highlights the seasonal trends in consumer spending, with higher sales figures in the months leading up to the holiday season, such as December and October. The lower sales figures in the summer months, such as August and September, may be due to consumers prioritizing other expenses such as travel and vacations.
"Products commonly purchased together by customers"
Used python to analyze. this type of analysis is known as "affinity analysis". This can reveal patterns and relationships between products that may not be immediately apparent.


Finally these are the top 3 products purchased by the customer together. I phone and lightning charging cable- 1005 purchase count, Google phone and USB-C charging cable 987 purchase count, iphone and wired headset 447 purchase count.